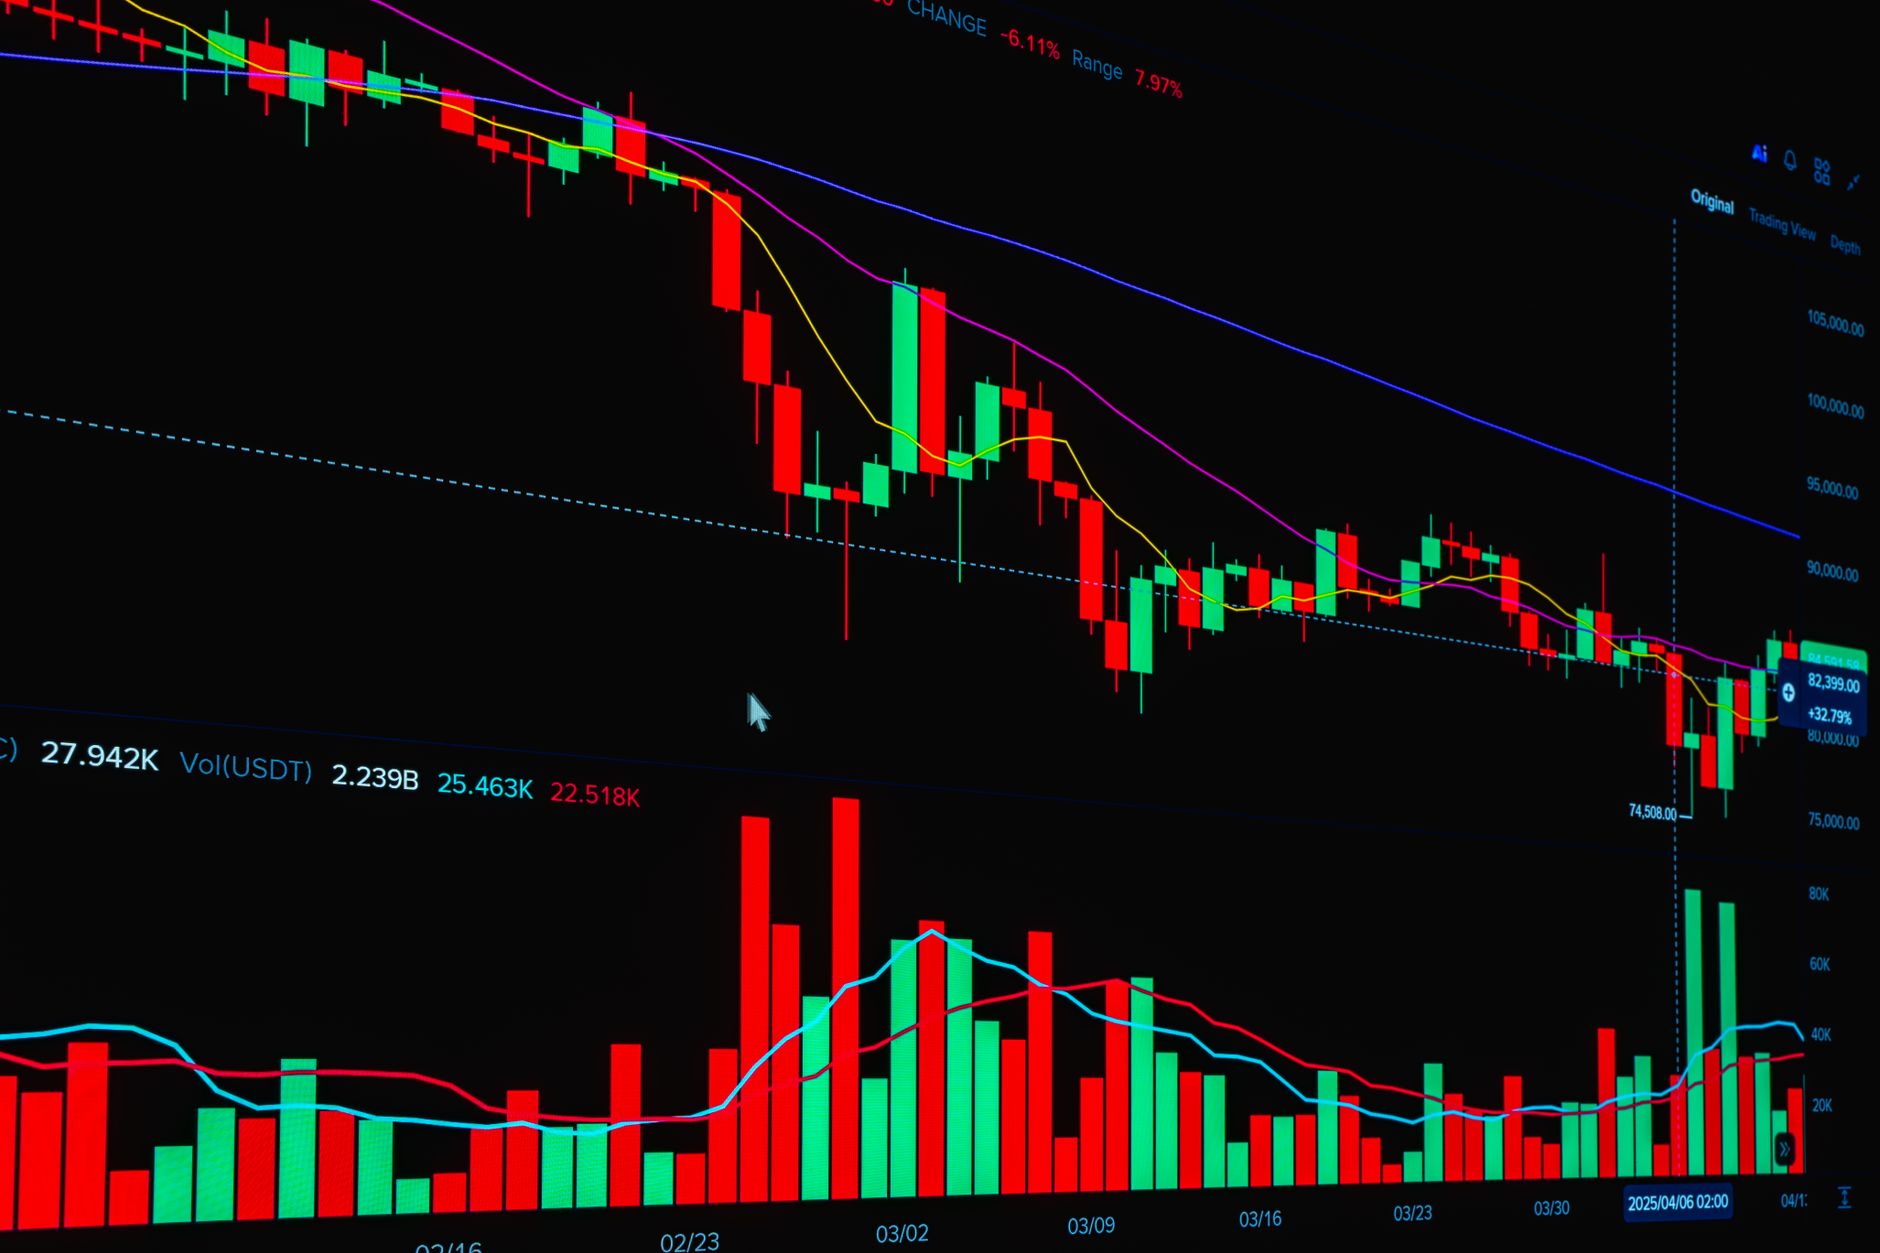
The broader technical picture of India’s Nifty 50 index remains corrective and confined within a narrow range. Recent price action has pushed the index below its 20‑week moving average of 23,955.75 and further beneath the 100‑week average of 24,386.81. The 50‑week average, positioned at 24,641.63, stays considerably higher, underscoring the depth of the current pullback.
Current Technical Landscape
At the more immediate level, the 23,500 mark, which was previously identified as support, has now been breached and is functioning as the first line of resistance. On the downside, the 23,000‑23,100 band constitutes the next critical support zone. The index is therefore compressed between this near‑term resistance and the aforementioned support range.
The weekly Relative Strength Index (RSI) reads 39.39, remaining well below the neutral 50 threshold. A sub‑50 RSI typically signals that momentum is on the bearish side of the spectrum. Complementing the RSI reading, the weekly Moving Average Convergence Divergence (MACD) has produced a negative crossover and is currently positioned beneath its signal line, reinforcing a bearish bias in the short‑term outlook.
Analysts suggest that a decisive move back above the 23,500 resistance level could ignite a broader technical rebound. Conversely, a clear break beneath the 23,000 floor would erode the existing structure and increase the probability of a deeper retracement toward the region of the 200‑week moving average, though the exact level of that longer‑term average is not disclosed.
Sector Momentum Insights
Relative strength and momentum across individual sectors are being tracked through RRG™ charts, which compare each group’s performance against the broader NIFTY500 index. The Nifty Financial Services Sector Index and the FMCG sector have both slipped into the lagging quadrant. According to the analysis, placement in this quadrant suggests that these sectors are likely to underperform the broader market in the near term.
Similarly, the Nifty Energy, Infrastructure, and the PSU (Public Sector Undertaking) Indices are also situated in the lagging quadrant. Despite their lagging classification, the commentary notes a sharp improvement in their relative momentum, indicating that they may be narrowing the performance gap with the broader market.
In contrast, the IT sector resides within the improving quadrant and is on the cusp of moving into the leading quadrant, signaling a potential shift toward outperformance. The Nifty Services Sector, Nifty Bank, and PSU Bank indices share the improving quadrant designation, implying stronger relative momentum compared with the broader index.
It is emphasized that the RRG charts illustrate relative strength and momentum and are not intended as direct buy or sell signals. Their purpose is to provide a comparative view of sectoral performance rather than to prescribe specific trading actions.
Potential Scenarios Ahead
If market participants manage to push the Nifty back above the 23,500 resistance level, technical models anticipate a larger rebound that could test higher moving averages, including the 20‑week average at 23,955.75. Such a breakout would also likely lift the RSI, potentially moving it toward the neutral zone, and could prompt a bullish MACD crossover.
On the other hand, a sustained decline that breaches the 23,000 support floor would validate the bearish signals from both RSI and MACD. In that scenario, the index could head toward the 200‑week moving average region, a level historically associated with deeper corrective phases. The lagging sectors, particularly Financial Services and FMCG, would be expected to lag further, while the improving sectors such as IT and Banking might provide relative resilience.
Traders and investors are therefore watching the 23,500 resistance and the 23,000‑23,100 support zone as the pivotal points that will define the next leg of the Nifty’s movement. The confluence of moving‑average breaches, a sub‑neutral RSI, and a bearish MACD crossover creates a technical environment that leans toward caution, pending clear price action at these key thresholds.
Overall, the Nifty’s current positioning reflects a market in a corrective phase, with sectoral dynamics offering both underperforming and improving narratives. Market participants are advised to monitor the identified support‑resistance corridor and the evolving sector momentum for clues about the index’s trajectory in the coming weeks.






Be First to Comment