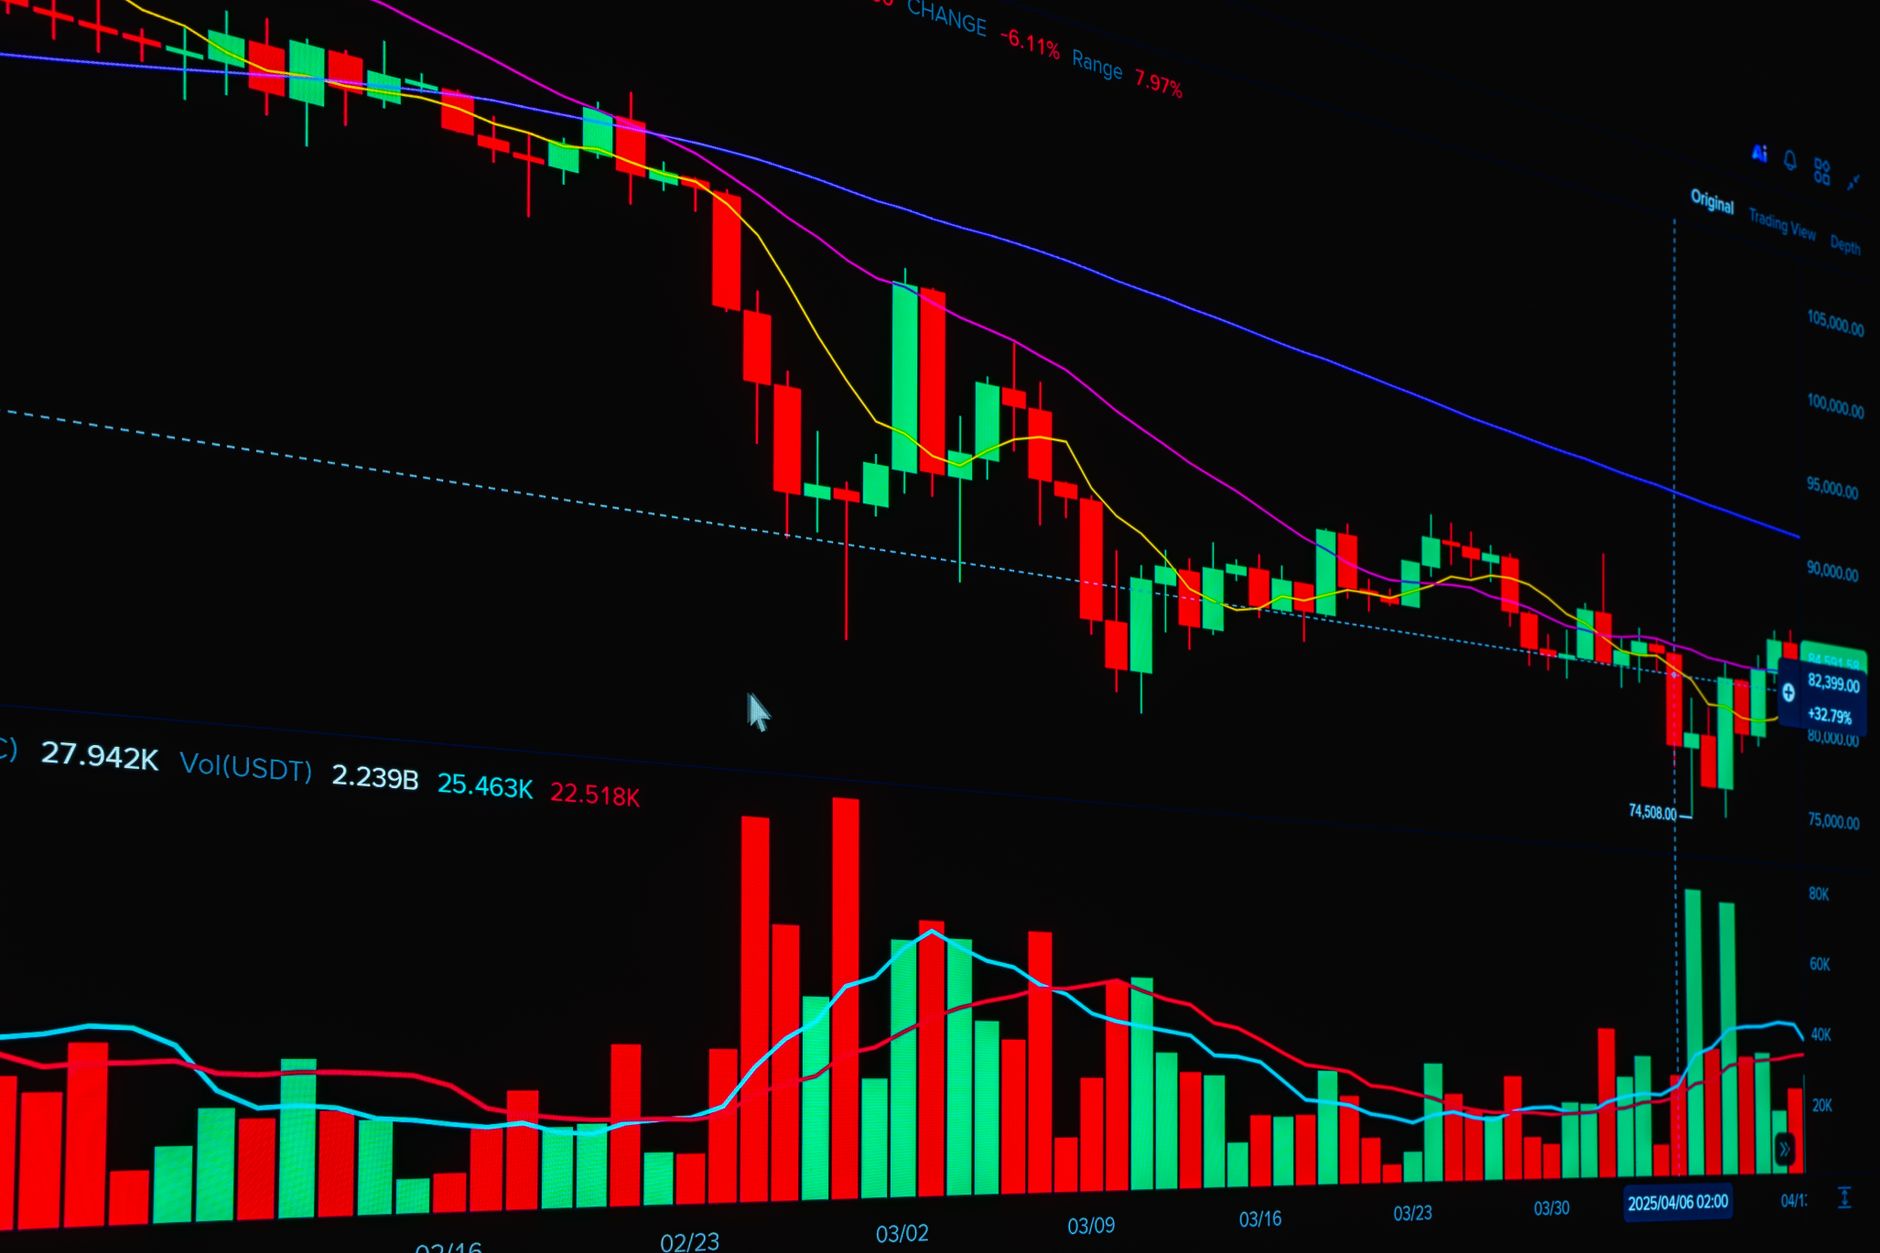
India’s benchmark Nifty 50 index opened the October futures and options (F&O) series under a cloud of bearish sentiment. Four distinct indicators point to a fragile market outlook as the festive month begins, according to market strategists and technical analysts.
September’s sharp decline marks a 25‑year low
During the September derivatives expiry, Nifty fell 6.7%, a drop not seen since September 2001 when the index slipped 6.5%. The decline erased more than 1,400 points, pushing the index to a long‑term support zone that was last tested during the COVID‑19 crash. Elevated crude oil prices, a weakening rupee, rising bond yields and persistent foreign selling were cited as the primary drivers of the sell‑off.
The weakness extended beyond the monthly expiry. Nifty has closed in the red for seven straight weeks and faces an eighth consecutive weekly decline if the market does not rally this week. An eight‑week losing streak would be the longest since 2001, when the index logged nine straight weeks of losses.
Foreign institutional investors record outflows
Foreign institutional investors (FIIs) ended a two‑month buying streak in September, selling Indian equities worth ₹25,662 crore – the highest monthly outflow in six months. Both Nifty 50 and Sensex fell about 5.7% during the month. Cumulative outflows for the year have crossed ₹2.5 lakh crore, according to NSDL data, putting FIIs on track for a record annual net exit.
V K Vijayakumar, chief investment strategist at Geojit Investments, linked the 5.67% correction in Nifty to “elevated crude and high US bond yields,” adding that the correction intensified when FIIs turned into “big sellers.” He noted that 10‑year US Treasury yields were hovering around 5.2%, making the foreign selling a “rational act.”
Vijayakumar also observed a shift of foreign capital toward AI‑heavy markets such as South Korea and Taiwan, which contributed to the record outflows. Despite the selling pressure, he argued that the correction created a “value buying opportunity” for domestic investors, highlighting large‑cap financials, capital goods, telecom and automobile stocks as attractive.
Bearish bets carried into October
Data from the September series showed broad‑based selling and a buildup of short positions by overseas investors. Nearly half of futures and options contracts ended the month with long positions unwound, while more than 40% saw an increase in shorts.
Rollover figures suggest that these bearish bets have largely been transferred into the October series. Nifty rollovers stood at 74%, matching the three‑month average, while Bank Nifty’s rollover was 79%, marginally above its 78% average.
Open interest in Nifty futures rose nearly 30% from the start of September, a sign, according to IIFL Capital, of “heavy shorts.” Net index‑futures shorts held by FIIs increased to about 267,000 contracts from 184,000 at the previous expiry, as per Nuvama data. ICICI Securities reported the same net short figure, describing it as one of the highest levels observed at the start of a series.
SBI Securities noted that Nifty futures ended the September series with a 6.56% loss and that rollover activity, at 74.29%, was below the previous series’ 77.39% and the three‑month average of 74.49%, indicating a cautious tone amid heightened volatility.
Technical support levels under pressure
The recent decline has brought Nifty to its 200‑week moving average, a long‑term support level not tested since the COVID‑19 crash. Rupak De, senior technical analyst at LKP Securities, placed the 200‑week average at 22,600 points. He warned that a decisive break below that level could trigger a sharper correction, while a hold above could pave the way for a recovery toward the higher end of the range.
ICICI Securities identified the 200‑week exponential moving average near 22,400 points, coinciding with the 80% Fibonacci retracement of the prior up‑move and a rising trend‑line support, creating a strong confluence of support.
Market breadth appears to be deteriorating: 82% of Nifty 500 stocks were trading below their 50‑day simple moving averages. The index’s daily Relative Strength Index (RSI) hovered around 27, showing positive divergence, while the weekly stochastic oscillator was in an oversold zone, conditions that could support an intermediate technical pullback.
For a meaningful recovery, analysts said Nifty needs to reclaim and close above the prior week’s high of 23,080, a level it has failed to surpass for seven weeks. A hold above the long‑term support could trigger a bounce, whereas a break below would reinforce expectations of a deeper correction.
Vijayakumar added that a correction in crude oil prices could spark a rally, with large‑cap market leaders potentially leading the rebound.
The technical and flow‑based indicators together paint a picture of a market at a crossroads as the October series begins. Investors will be watching closely for any sign of resilience around the 22,600‑22,800 band, while foreign fund flows and the continuation of short‑position rollovers remain key variables in the weeks ahead.






Be First to Comment