The benchmark Nifty50 ended the week of September 25 at 23,140.5, extending a seven‑week decline that now totals 5.8%. While the slide is modest compared with historic downturns, the prospect of an eighth consecutive weekly loss has turned the market’s routine correction into a record‑watch event.
Historical perspective on extended declines
In the past 25 years the index has recorded seven or more straight weekly losses only four times – in 2001 (twice), 2008 and 2020. The longest losing streak on record remains ten weeks ending April 23, 1993, when the index fell 22.9%. A nine‑week streak ending April 13, 2001, saw a 27.1% drop. The current seven‑week fall is far smaller than the 20.5% loss that concluded on September 21, 2001, the 22.1% decline that ended July 4, 2008, and the 33.3% plunge that finished April 3, 2020.
If the index slips for another week, it would join the rare group of eight‑week losing runs and would be the first such streak since the early 2000s.
Technical outlook remains bearish
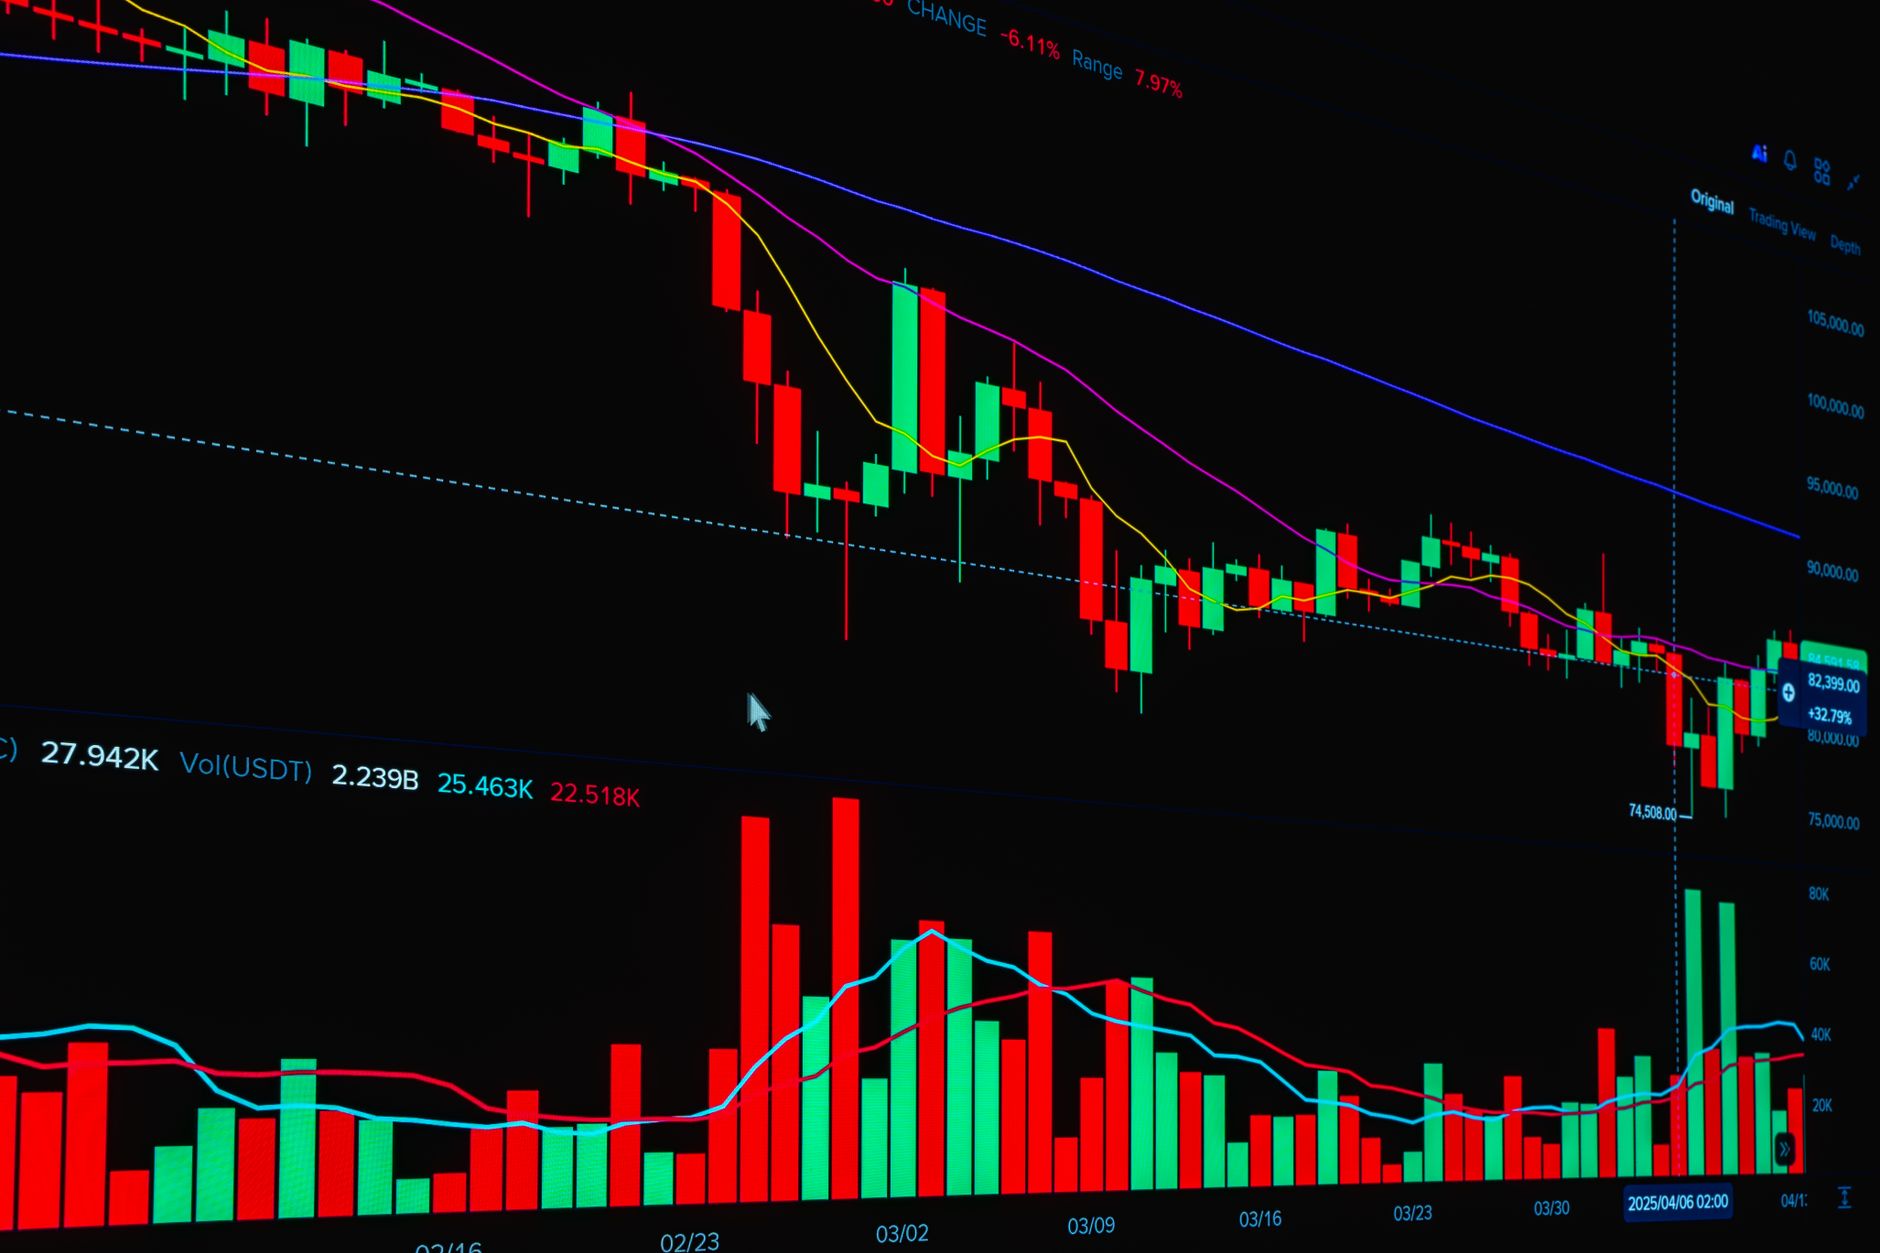
Technical analysts note that the Nifty continues to form lower tops and lower bottoms on the daily chart, indicating an ongoing downtrend. Sudeep Shah, Head of Technical and Derivatives Research at SBI Securities, said momentum indicators still point to weakness. “RSI remains below 40, while MACD continues to slope downward below the zero line, keeping momentum weak. ADX continues to rise, indicating that bearish trend strength remains elevated. Nifty continues to trade below its 20‑day and 50‑day EMAs,” he explained.
Shah added that a meaningful directional shift would require short covering accompanied by sustained buying, and until that materialises the broader structure stays bearish.
Rupak De, Senior Technical Analyst at LKP Securities, highlighted that the index has slipped to its 200‑week moving average for the first time since the Covid‑19 crash. The 200‑week average sits at 22,600. De warned that a decisive break below that level could trigger a sharper correction, while holding above it might support a recovery toward higher levels. He identified 22,800 as the immediate resistance.
Global macro pressures and policy expectations
Technical weakness is compounded by an unfavourable global backdrop. Brent crude futures are trading above $100 a barrel and the U.S. 10‑year Treasury yield has risen above 5%, levels not seen in two decades. Foreign Institutional Investors (FIIs) have withdrawn roughly Rs 26,000 crore this month, taking cumulative outflows to around Rs 2.5 lakh crore.
Against this environment, BofA Securities now projects that the Reserve Bank of India (RBI) will raise its policy rate by 25 basis points at the October monetary‑policy meeting, ending almost two years of accommodation. The brokerage also doubled its forecast for total rate hikes this cycle to 100 basis points, citing rising supply‑side inflation risks from higher energy prices and the possibility of increased fuel costs. BofA added that robust growth could keep inflation expectations elevated, shifting the risk balance toward inflation management rather than growth protection.
Vinod Nair, Head of Research at Geojit Investments, said volatile crude prices, elevated U.S. Treasury yields and persistent FII outflows continue to pressure domestic equities and the rupee. He also pointed to the unprecedented pace of IPO fundraising as an additional liquidity drain, noting that investor risk appetite remains subdued amid a hawkish global backdrop and rising odds of further rate hikes later in the year.
Nair cautioned that geopolitical tensions, particularly the U.S.–Iran conflict, could influence near‑term sentiment. A meaningful de‑escalation could spark a sharp rally driven by improved risk sentiment, but until then investors are likely to remain selective, favouring companies with solid fundamentals and clear earnings visibility.
Valuation considerations and earnings outlook
Not all market participants expect the correction to deepen. Siddhartha Khemka, Head of Research, Wealth Management at Motilal Oswal Financial Services, argued that domestic activity is offsetting global weakness. He cited an 8% year‑on‑year growth in the Index of Industrial Production for August, a revival in urban discretionary demand and resilient GDP growth. Khemka said that after a 6.8% correction, valuations have moved into more reasonable territory and downside from current levels should be limited.
Alok Agarwal, Deputy CIO at Alchemy Capital Management, observed that the Nifty has become relatively cheaper after a period of subdued returns and slow earnings growth. He noted that the index was trading at a one‑year forward price‑to‑earnings multiple of 17.4× in September 2026, down from 21.5× in September 2024. Over the same period, the index corrected 11% while earnings continued to grow, albeit at a slower pace. Agarwal said the current multiple is close to the lowest seen in the post‑Covid era.
Motilal Oswal added that market consolidation and earnings recovery from FY25 lows have cooled valuations from 2024 peaks. Large‑ and mid‑caps saw valuation corrections of 29% and 27% respectively, while small‑caps corrected 4% on a 12‑month forward P/E basis. The Nifty 50 was trading 16% below its LPA (lowest price in the last 12 months), whereas mid‑ and small‑caps were 4% and 27% above their respective LPAs. These premiums had been 20%, 50% and 47% respectively in September 2024. The brokerage concluded that with valuations now significantly below peaks, healthy earnings growth and a strong macro environment, the risk‑reward profile for Indian equities has improved.
Motilal Oswal also warned that the higher earnings growth rates in mid‑ and small‑cap segments suggest that market performance is likely to remain bottom‑up in nature.
The immediate test for bulls is clear: the Nifty must hold the 22,600 support level and attract sustained follow‑up buying to prevent the current seven‑week decline from extending into an eighth week. Failure to do so would push the index into territory last seen in 2001, though the magnitude of the present slide remains modest compared with earlier extended losing streaks.






Be First to Comment